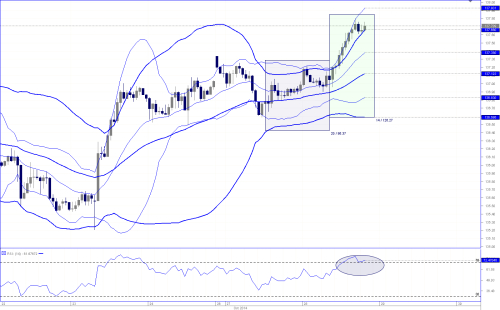
The EURJPY has been on a breakout to the upside in the 1H chart. The image below depicts a typical Bollinger Band breakout that I have described in my submission to the article contest this month.
5 Profitable Setups through Bollinger Bands - If you have not read it, click on the link to see the setups described.

This 1 Hour chart shows the typical contraction/squeeze/breakout as described in the article. What we are seeing now, is the potential of a double top/ M top formation forming against the 20 period bands, however, the price is still trading well outside the 50 period bands. In fact on a pull back, the price found support at the top of the 50 period upper band.
RSI is quite oversold as indicated by the eclipse.
I am looking for a reversal and hence looking to short, but right now the bands show that the momentum is to the upside and has not slowed down enough to signal a sell entry. Will continue to monitor the price for short entries.
5 Profitable Setups through Bollinger Bands - If you have not read it, click on the link to see the setups described.

This 1 Hour chart shows the typical contraction/squeeze/breakout as described in the article. What we are seeing now, is the potential of a double top/ M top formation forming against the 20 period bands, however, the price is still trading well outside the 50 period bands. In fact on a pull back, the price found support at the top of the 50 period upper band.
RSI is quite oversold as indicated by the eclipse.
I am looking for a reversal and hence looking to short, but right now the bands show that the momentum is to the upside and has not slowed down enough to signal a sell entry. Will continue to monitor the price for short entries.

