 Open trading account
A Simple Way to Scalp Forex Market-Live Orders
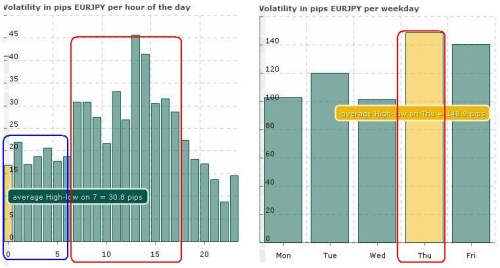
Figure.1
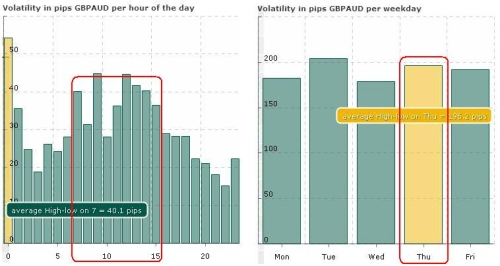
In figure nr.1 ,EUR/JPY,we have a good volatility which start a tabout 7:oo GMT
We don’t know where the price go, up or down. I don’t know exactly, this is not a japanese train, but with Volatility and Correlations we are closer the true.
On the chart I used Bollinger Bands , RSI set at 21,and 5 Ema (5Ema is a suggestion of DumbAsArock and is not bad) .
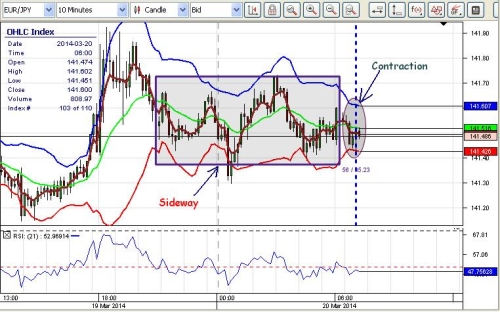 Figure.2
In picture nr.2 we will watch the price at 7:00 GMT
And now at 9:28 GMT
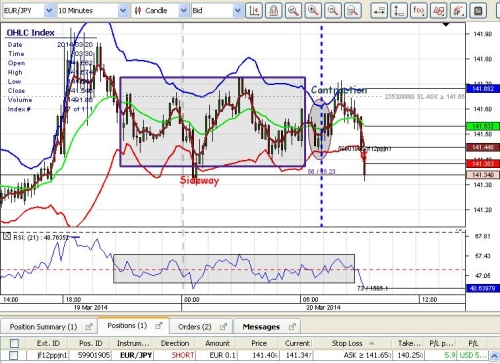 Figure.3
The price crossed red dot line from 50 level of RSI and 5 EMA crossed middle line from Bollinger Band .
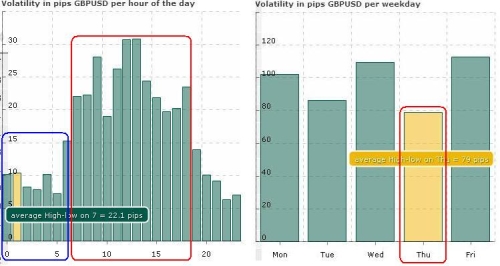
GBP/USD has today low volatility ,but I watch it and no triggered Entry point yet .
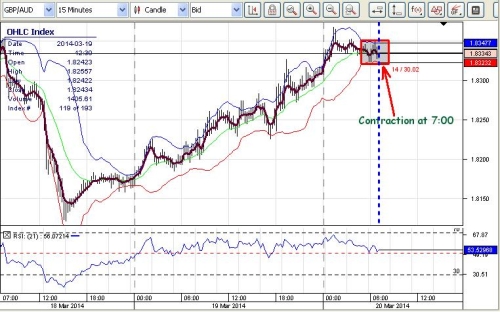
And finally GBP/AUD .
Here again I think trend will start at 7:00 GMT .I’m not a wizard,but I try to read the market .
Blue dot line is 7:00 GMT
Now at 9:32 GMT
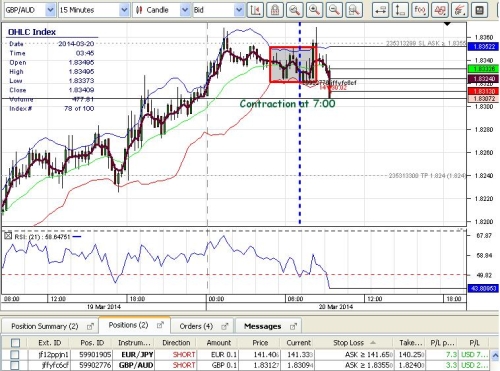
The price crossed red dot line from 50 level of RSI and 5 EMA crossed middle line from Bollinger Band .
GBP/USD not triggered ,Buy or Sell point,not yet .
Best Regards