Last week I've been giving out my own analysis on the yen pairs,arguing that we may see a rebound in the XXX/JPY currency pairs, you can find my blog post here: Still Confused about XXX/JPY Sell Of? What's next My whole analysis was around the point that Nikkei index which was at an important pivotal point is about to resume the uptrend and thus dragging the XXX/JPY pairs in the direction of the main trend.
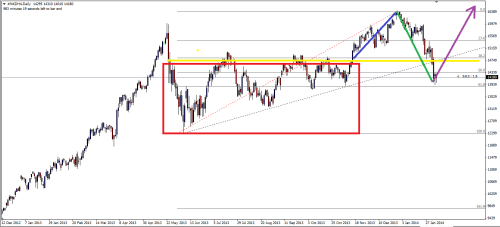
  • Figure 1. Nikkei Index Last week price action.
In Figure 1 you can see how the price action on the Nikkei Index was last week, we where approaching an important Fibonacci level. If we connect the last major swing low 12300 and the last major swing high 16395 we can see that the price has retrace all the way down to the 61.8% fib level. Also it made a false breakout below the major support zone (see yellow line), I have spoken about false breakouts or traps in the past as well, in a bear market we will see bull traps and in a bull market we'll see bear traps, which is our case. If you want to see how bulls traps looks like check out my blog post: EUR/USD Bull Traps and here: EUR/USD Bull traps (part 2)


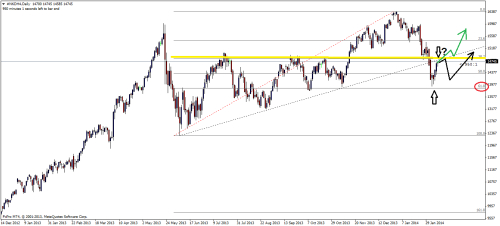
  • Figure 2. Nikkei Index Daily Chart.
In Figure 2 we can see how nicely we rebounded from the 61.8% fib level, and look where we stopped(yellow line), this is no coincidence. Now from here there are 2 possible scenario either this line will act like a minor resistance zone and we will push for a retest of the lows or either we are going to push straight through this yellow zone and continue upwards. We need to have a close above this line in order to confirm our second scenario.

Best Regards,
Daytrader21
Перевести на Английский Показать оригинал