Hello Traders,
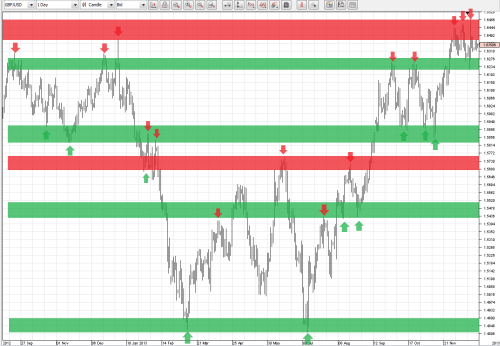
IMHO here are the key support and resistance areas on GBP/USD Daily. The areas marked in red represent key resistance, while the areas marked in green represent key support. Each key support or resistance area should be between 50 and 100 pips. We want each area to capture as much price action as possible, including previous price history (green and red arrows).
Please note that there is no Upside-Down-V-Shape at the top resistance area. However, as this is the highest price area and price failed to break higher for three time, it's also a clear resistance area:

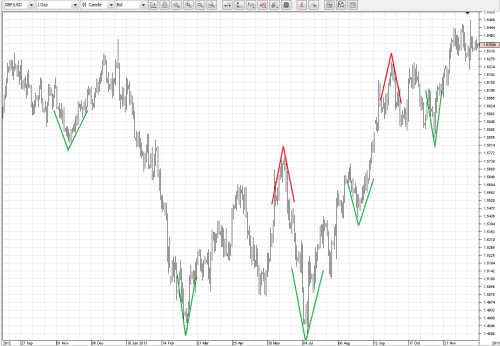
We search for V-Shape formations to find strong demand / support areas. We search for Upside-Down-V-Shape formations to find strong supply / resistance areas:

This analysis is based on the method explained in my article. I hope you find it useful for your trading!
Happy trading :-)
geula4x
IMHO here are the key support and resistance areas on GBP/USD Daily. The areas marked in red represent key resistance, while the areas marked in green represent key support. Each key support or resistance area should be between 50 and 100 pips. We want each area to capture as much price action as possible, including previous price history (green and red arrows).
Please note that there is no Upside-Down-V-Shape at the top resistance area. However, as this is the highest price area and price failed to break higher for three time, it's also a clear resistance area:

We search for V-Shape formations to find strong demand / support areas. We search for Upside-Down-V-Shape formations to find strong supply / resistance areas:

This analysis is based on the method explained in my article. I hope you find it useful for your trading!
Happy trading :-)
geula4x


