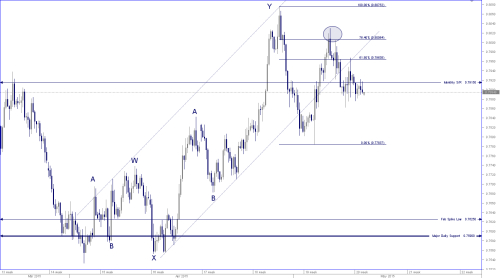
The AUDUSD has recently shown a major channel break on it's 4H chart, suggesting a further bearish continuation.
The chart below shows the break, as well as an Elliott Wave count that suggests the structure from 02 April Lows has been completed

So far, we can see that after a brief channel break, the pair came back up to retest the 76.4% Fibonacci Level and has once again broken lower. As well, we can see another retest of the bottom of the channel which was also met with a bearish rejection.
With risk favoring the downside in this pair, it is worthwhile keeping an eye on the 1H chart. Currently there is a rising trendline in play which is already showing a potential 1H close below. Further conviction would come if momentum increased to the downside, giving a clear break from the trendline.

A clear break lower here can see the pair retest Major Daily Support, which comes in at 0.7590
The chart below shows the break, as well as an Elliott Wave count that suggests the structure from 02 April Lows has been completed

So far, we can see that after a brief channel break, the pair came back up to retest the 76.4% Fibonacci Level and has once again broken lower. As well, we can see another retest of the bottom of the channel which was also met with a bearish rejection.
With risk favoring the downside in this pair, it is worthwhile keeping an eye on the 1H chart. Currently there is a rising trendline in play which is already showing a potential 1H close below. Further conviction would come if momentum increased to the downside, giving a clear break from the trendline.

A clear break lower here can see the pair retest Major Daily Support, which comes in at 0.7590


