Last month I've posted this analysis that you're about to read in the Technical Analysis Contest, you can find the original post here: GBP/USD Fractal Map I thought to share it here as well since it has provided a good road map in trading cable so far.
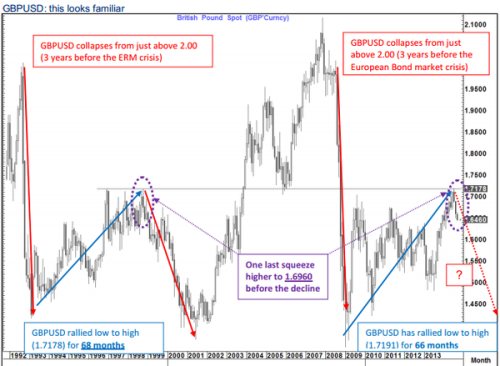
Cable's price action looks quite familiar and it's a fractal of the 1992-2000 price action (see Figure 1). We can see that the massive sell off in the 90's resemble the sell off that we had in 2007-2008 and going forward both sell offs have seen a 66 months retracement. Not only that the price action looks similar but also time wise this fractal looks similar. This fractal will suggest that eventually we'll have to see another major swing low below 1.3490 before the market to enter in the next phase and the cycle to change to the upside. We also have to keep in mind that the broad base dollar strength is supporting this forecast.

On the Weekly chart we can have a look at the bigger support and resistance level (see Figure 2)which can provide further clues on how this fractal may develop. Current rally from 1.500 big round number and support level coincide with the same type of action from 1999, as per our fractal model (see Figure 1). This only suggest that for the next 2 months the market should be trading inside this range from 1.5500 resistance level and 1.5000 support level before to see the next leg down.

Based on the Fractal model and my projections we should see an exchange rate for GBP/USD of 1.5069 for 1st of April 2015
Best Regards,
Daytrader21
Cable's price action looks quite familiar and it's a fractal of the 1992-2000 price action (see Figure 1). We can see that the massive sell off in the 90's resemble the sell off that we had in 2007-2008 and going forward both sell offs have seen a 66 months retracement. Not only that the price action looks similar but also time wise this fractal looks similar. This fractal will suggest that eventually we'll have to see another major swing low below 1.3490 before the market to enter in the next phase and the cycle to change to the upside. We also have to keep in mind that the broad base dollar strength is supporting this forecast.

Figure 1. GBP/USD Monthly chart. Fractal Map
On the Weekly chart we can have a look at the bigger support and resistance level (see Figure 2)which can provide further clues on how this fractal may develop. Current rally from 1.500 big round number and support level coincide with the same type of action from 1999, as per our fractal model (see Figure 1). This only suggest that for the next 2 months the market should be trading inside this range from 1.5500 resistance level and 1.5000 support level before to see the next leg down.

Figure 2. GBP/USD Weekly Chart
Based on the Fractal model and my projections we should see an exchange rate for GBP/USD of 1.5069 for 1st of April 2015
Best Regards,
Daytrader21


