Hi guys today I wanna share with you a trade pattern idea that I've posted in Technical Analysis Contest you can find the original post here: EUR/GBP Downward Channel
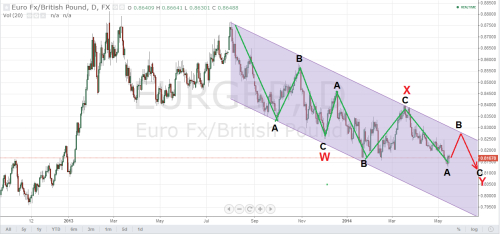
Since beginning of 2013 EUR/GBP has established an downward channel trading in an persistent bearish trend which has not found a bottom yet. Based on Elliott Wave count this is a bigger correction which is taking form of an double zig-zag pattern. Right now we're in the last stage of forming the last leg Y but we first we need a 3 wave movement(see red line Figure 1). We need a last rally towards the upper border of trading channel to form wave B and next another swing low below the 0.8100 level.

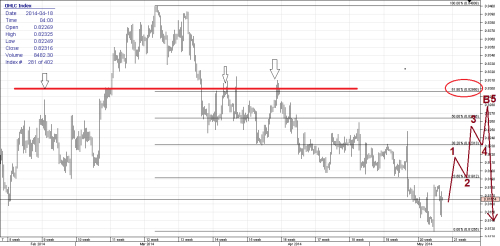
Next we want to look over much shorter time frame like the 4h chart (see Figure 2)in order to guide the immediate price action and see where are major support and resistance level. The 61.8% fib retracement is at a very confluence zone where we have plenty of pivot points at around 0.8290 which should hold any upside movement and where wave B should find his pick. This upside leg should take form of an five wave of lesser degree to the upside and than price should collapse towards our target.

Best Regards,
Daytrader21
Since beginning of 2013 EUR/GBP has established an downward channel trading in an persistent bearish trend which has not found a bottom yet. Based on Elliott Wave count this is a bigger correction which is taking form of an double zig-zag pattern. Right now we're in the last stage of forming the last leg Y but we first we need a 3 wave movement(see red line Figure 1). We need a last rally towards the upper border of trading channel to form wave B and next another swing low below the 0.8100 level.

Figure 1. EUR/GBP Daily Chart. Downward Channel.
Next we want to look over much shorter time frame like the 4h chart (see Figure 2)in order to guide the immediate price action and see where are major support and resistance level. The 61.8% fib retracement is at a very confluence zone where we have plenty of pivot points at around 0.8290 which should hold any upside movement and where wave B should find his pick. This upside leg should take form of an five wave of lesser degree to the upside and than price should collapse towards our target.

Figure 2. EUR/GBP 4h Chart.
Based on Elliot Wave count analysis we should expect an exchange rate for EUR/GBP of 0.8110 for 1st of July.Best Regards,
Daytrader21


