 Open trading account
Hi contenders,
Looking for patterns on the 4h charts I observe a Bullish Gartley on GBP/CHF using Fibonacci Retracements:
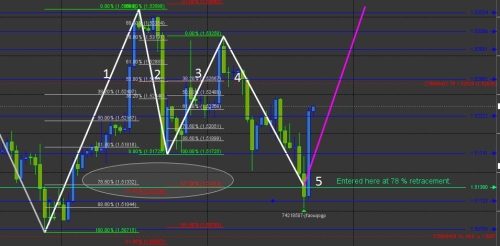
Down trend into resistance at ~1.50700.
Gone up (1) and retracing to ~62 % (2)
Going back up again (3) to ~78% of line 2.
Going down now on line 4. Place order at confluence (ellipse) of 78% of line 1 and 127% of line 3.
Initial SL right after base of 1 and TP at 78% of line 4
It still went down another ~40 pips, but now it is up ~80 pips with 5mio exposure.
Regards,
mosu_d
