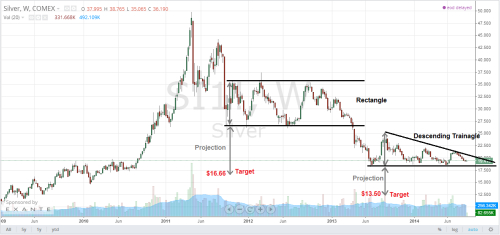
Silver and gold have been on tears this week and it comes as no surprise here as the Fed finally has put an end to the almighty QE program. Silver has been hitting my first target of $16.66 projected by the October 2011-April 2013 rectangle pattern (see Figure 1). You can check out my last article about silver through my blog history.


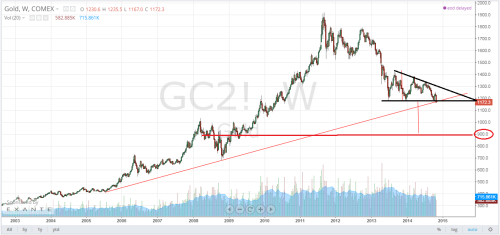
It is no surprise that after Silver broke last month key support level of $18.20 it was just a matter of time for gold to follow suit and break key support level of $1180. You can check that blog post where I talk in more details about the implication of such a move here: Metal Outlook. Silver leading the way down
For Silver the next target is at $13.50 the descending triangle projection.
With the end of the QE era, it's no surprise about the timing of gold breakout and the end of tapering as this week Fed decided to put an end to the QE program. Gold has been long considered being correlate with inflation and even though that's no true, that doesn't matter, what matters in the market is what majority believe is the truth even though they may be wrong on that. The correlation between gold and inflation year over year is less than 0.5 and on a month over month basis, the correlation is less than 0.15.

Best Regards,
Daytrader21


Figure 1. Silver Weekly Chart
It is no surprise that after Silver broke last month key support level of $18.20 it was just a matter of time for gold to follow suit and break key support level of $1180. You can check that blog post where I talk in more details about the implication of such a move here: Metal Outlook. Silver leading the way down
For Silver the next target is at $13.50 the descending triangle projection.
With the end of the QE era, it's no surprise about the timing of gold breakout and the end of tapering as this week Fed decided to put an end to the QE program. Gold has been long considered being correlate with inflation and even though that's no true, that doesn't matter, what matters in the market is what majority believe is the truth even though they may be wrong on that. The correlation between gold and inflation year over year is less than 0.5 and on a month over month basis, the correlation is less than 0.15.

Figure 2. Gold Weekly Chart
Final target on this bearish gold trend is at around $900 level which is also the descending triangle projection target (see Figure 2).Best Regards,
Daytrader21


