Since I start blogging I've been giving out my outlook on gold both short term and long term, outlining the main points of why we may soon start another bullish trend but at the same time being caution of the possibility that we may get another major swing low, below the psychological level $1000, before the resumption of the gold secular bull trend. Here you can find my previous blog posts about gold: Gold - Next Move ; 1979 Russia Invasion of Afghanistan. 2014 Ukraine. Gold Price ; Gold Outlook .
The only reason why I'm posting those links is for you to judge by yourself how good or bad my predictions where.
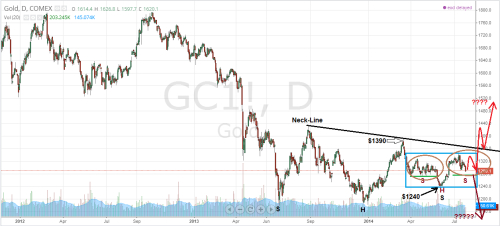
In this blog post we are going to analyse the recent gold price structure and see if we can spot some trading ideas. On the daily chart (see Figure 1) we're forming an inverted H&S bottom which can signal a big reversal coming but in order to have our confirmation we need a break of the H&S's neck-line and a close above $1390, last swing high. Not only that we have this massive inverted H&S bottom but on the right shoulder (see blue box) we're currently developing another inverted H&S pattern. Can this double inverted H&S pattern be enough to turn the current bearish trend? Well, that remain to be seen as we first need to wait for the breakout in order to validate the pattern. It can take more than few weeks until this second inverted H&S is finished.

Figure 1. Gold Daily chart. Inverted H&S pattern
I'm not going to lie but I was both short and long during the past few weeks as for now we still don't have any clear direction and even today I took a small short position from $1397. This inverted H&S comes perfectly in line with my long term view that I've expressed here: Gold Outlook .
It may be the case that we're heading for new all time highs and resume the secular bullish trend that started from 2001.On a daily basis the market seems overbought so this can also suggest that we may consume all this bullishness in some kind of range environment as we'll develop the right shoulder of the second inverted H&S pattern (see maroon circle).
However we must stay on alert as any break below the $1240 level which is the right shoulder of first inverted H&S pattern and also is the head of the second inverted H&S pattern, will invalidate this pattern and we should expect further downside.
Guys, what is your view on gold? I'm really looking for other opinions.
Best Regards,
Daytrader21


