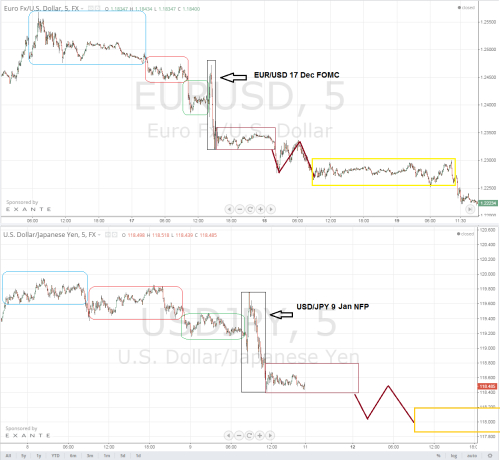
Yesterday I was walking through my charts to prepare my analysis for the coming week and I have found an interesting Fractal (see Figure 1)that may help you track the price action on USD/JPY on every level. But even though we're comparing two historic periods with 2 different events (FOMC/NFP) and it may be the case the market reaction on this two events may be different historically the only reason why I trust this fractal is because it's converging with my previous view on USD/JPY that you can find it here: USD/JPY Elliott Wave Cycle Completed
But using this fractal it's giving you the advantage to micromanage your position more precisely. The only concern I have is having a gap Sunday night when the market are opening in which case the volatility expansion will distort the fractal. You'll have to keep in mind all this variable in order to measure the accuracy of a fractal.

Figure 1. EUR/USD leading USD/JPY
If you're interested to learn more about the power of fractals and how to use them I've wrote an article some time ago about it, you can find it here: How Fractals Can Explain Market Movements
PS: The header on this blog post is a beautiful fractal.
Best Regards,
Daytrader21


