Sometimes on chart there are signs for a move, but usually (always) they are more notable in the past, once you know where price went after that so called "pattern".
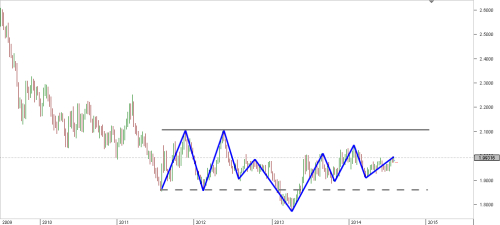
Look at the example below:

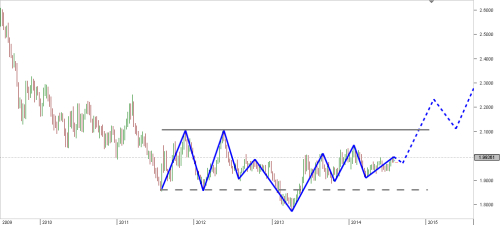
It SEEMS like there is a POSSIBLE bottom setup forming. So you basically imagine price going like this:

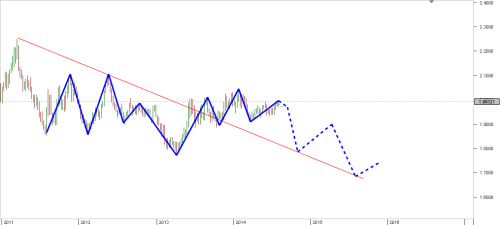
But really... what makes me to believe this is gonna happen? Probabilities? Ok but my money is not probability... Why should I buy this instrument because it could rise based in ... something?! Why can't it be like this other example:

After some years spent in chart - study I can definetly say both scenarios are equally probable!!!
In this case, there is just one distinction from any other chart: this is a long term WEEKLY chart!
You can wait for months for a pattern to become formed, but once it does, you find confirmation for a trade in any of the faster timeframes from daily till the 15minutes even 5 minutes.
So forget about anticipating a move: look for strong patterns formed in slow timeframes, and catch moves where you find confirmation in faster ones. There are so many instruments to trade out there, you will not be even able to follow all of them!!
Good luck.
Look at the example below:

It SEEMS like there is a POSSIBLE bottom setup forming. So you basically imagine price going like this:

But really... what makes me to believe this is gonna happen? Probabilities? Ok but my money is not probability... Why should I buy this instrument because it could rise based in ... something?! Why can't it be like this other example:

After some years spent in chart - study I can definetly say both scenarios are equally probable!!!
In this case, there is just one distinction from any other chart: this is a long term WEEKLY chart!
You can wait for months for a pattern to become formed, but once it does, you find confirmation for a trade in any of the faster timeframes from daily till the 15minutes even 5 minutes.
So forget about anticipating a move: look for strong patterns formed in slow timeframes, and catch moves where you find confirmation in faster ones. There are so many instruments to trade out there, you will not be even able to follow all of them!!
Good luck.

