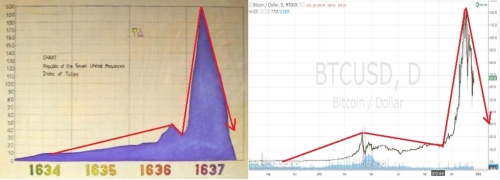
At beginning of the year I've made a big statement saying that Bitcoin is on a verge of major sell of. I was bearish on bitcoin because it was following the price action of Tulip Bulbs from 1634-1637. You can find that post here: How Fractals Can Explain Market Movements

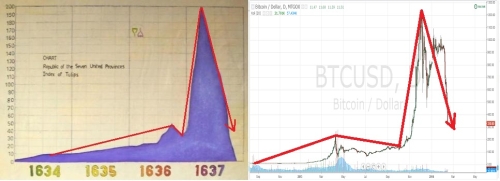
In Figure 1 you can see how price action was looking at the moment I've made that prediction. I have been using the Tulip mania fractal to forecast the Bitcoin mania, and many were sceptical of this to happen, and I was flooded with all king of arguments of why this is not possible. But in the end it seems like Bitcoin is following the famous Tulip mania and the cycle is almost completed as it can bee seen from Figure 2.

We are now in February as expected nothing much I can see here, really.
Best Regards,
Daytrader21

- Figure 1. Tulip Mania vs Bitcoin Mania. Chart posted at beginning of the year.
In Figure 1 you can see how price action was looking at the moment I've made that prediction. I have been using the Tulip mania fractal to forecast the Bitcoin mania, and many were sceptical of this to happen, and I was flooded with all king of arguments of why this is not possible. But in the end it seems like Bitcoin is following the famous Tulip mania and the cycle is almost completed as it can bee seen from Figure 2.

- Figure 2. Tulip mania vs Bitcoin Mania. Current Price Action.
We are now in February as expected
 nothing much I can see here, really.
Best Regards,
Daytrader21


