 In this article, I'm going to talk about FX seasonality cycles and how they can improve your trading activity and why it should not be ignored. There is no mystery that the world is full of cycles and we're governed by them and the financial market are not exception of this rule. The majority of traders will either use technical analysis, fundamental analysis or a combination of both. But the seasonality cycles will bring in a new dimension in which you can analyse the market. The time element such as the time of the day, the day of the week, the month of the year could also play a big role in how certain FX pairs may behave. So when you focus your attention purely on price and time without the noise of indicators you may notice that some pattern shows up during certain time and this patterns are known as seasonality. Seasonality are a predictable change in price that repeats every day, week, month, year at the same period in time.
 This seasonality cycles will only give you the tendency of an particular currency pair to bottom or top or rally or fall, at certain point in time. The seasonality is just an average so in this regard it's better not to use it in isolation but rather in combination with your technical analysis as the market can deviate from this seasonality cycles.
There are seasonality not only on a monthly basis but on every time level this seasonality pattern reoccur and are visible so in this regard we're going to start to look on every time level, and what is more important I'm going to try and apply this seasonal cycles to current price action and see if we can spot some trades.
- Intraday Seasonal Trends.
Before looking on how this seasonality cycles portrait the market it's important to be aware that we can divide our trading day into four major trading sessions: the Sydney session, the Tokyo session, the London session, and the New York session(see Figure 1). During each of this sessions liquidity is not distributed uniformly and this is one of the cause why this seasonality cycles appear on an intraday basis.

Figure 1. Major Trading Sessions.
Next we're going to look at two types of intraday seasonality cycles that will help us to step up our FX game:
- Intraday Volatility tendency;
- [b]Intraday top/bottoms tendency;
[/b]
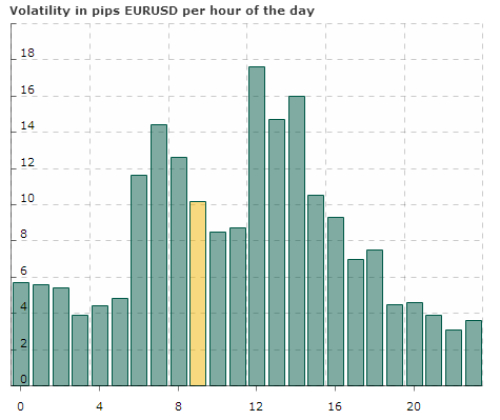
Figure 2 represents the EUR/USD volatility in pips per hour of the day from beginning of the year. This chart shows the EUR/USD tendency to have two main peaks in volatility:
- One at around 7:00-8:00 GMT, with the maximum ATR(Average True Range) around 14 pips;
- The second one between 12:00-14:00 GMT, with the maximum ATR around 18 pips;

Figure 2. EUR/USD Volatility in pips per hour of the day.
So, how is this information going to help you? If you're daytrading it will help you to time your trades much more better, to enter the market only around the time of the day when the ATR is at pick and it can show you a realistic expectation for the trade and how far away your TP should be.................................................If you wish to continue reading further go on the Article contest page here:Seasonal Cycles in Fx Trading
Best Regards,
Daytrader21


