 Open trading account
 Dear Traders,
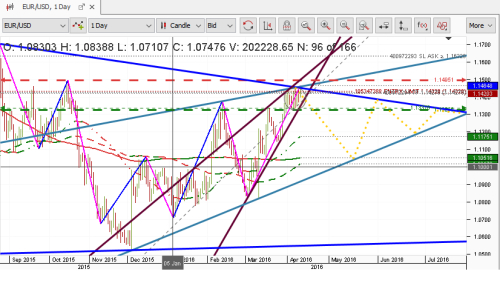
Posting Daily EURUSD chart to show , that pair currently trading at CRITICAL LEVEL to watch - in rather narrow range 1.1450/60 resistance - 1.1320/30 support ( actual 1.1370/80 1H 200 SMA as support), in the point where different time scale channel resistance and supports are meeting , which could explain, why we are trading all April in that point, as market can not define the futher movement direction and keeps consolidating, but despite bullish bias, the signs of weakness of bulls in the pair are strengthening . Every attemp move above 1.1450/60 resistance in April failed and it is lasting whole April. Fundamentals of EUR zone and US zone favors Dollar, JPY rise is stopped by warning from JCB intervention possibility, Brexit is coming closer and we could add as well FED no so strong dovishness lately as well as ECB readiness to add to applied ease before.
Based on all that Bearish movement could be expected, and YELLOW line in the chart shows possible scenario, but to confirm any direction the pair must break out from current range either above 1.1450/60 or below 1.1320/30.
Have a nice trading!
