 Open trading account
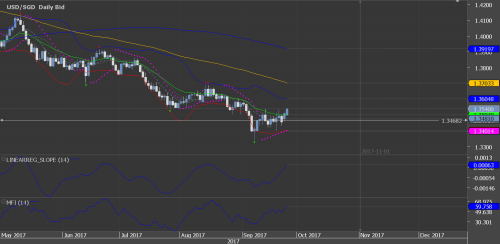
INDICATORS: Parabolic Sar, Money Flow Index, Linear Regression Slope
PAIR ANALYSIS :
USD/SGD is in abearish tendency after the bearish retracement at the resistance zone as indicated in fig 2.
The chart analysis indicates that the pair has been dominated by a trendless-slightly bearish position tendency with profitable opportunities along the resistance SMA_20 of the Bollinger Band as indicated in fig 2. The Linear Regression Slope around -0.002 and the configuration of the Parabolic Sar seem to support the slightly bearish market tendency. It could be considered to open a sell trade with 1.32981 TP.
A bearish crossing at 1.36892 could facilitate the domination of a bearish domination.
It can be evaluated a forecast level price at 1.34682.
FIGURE 1 shows the trendlines

FIGURE 2 indicates the forecasting pattern

