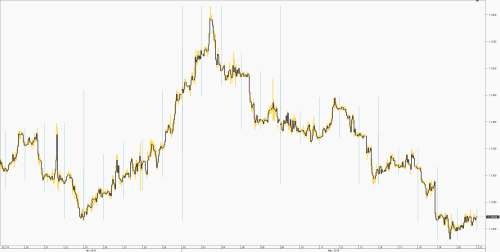
I am presenting a complete set of my custom made indicators in latest versions. Each with source code included. All of them are modified versions of original Dukascopy`s indicators code(which one is stated in the source code). I am releasing them based on previous agreement with Dukascopy. I will additionally add here that:
- Dukascopy take no responsibility for any modified indicators released by me
- I provide my indicators with no warranty, use at your own risk
- I am releasing them under same unmodified license as original indicators
- You are allowed to use them for your own personal use, disallowed for any commercial use or to sell them
Now after boring part is done, lets start:
HLBox(updated to v1.2):
This indicator allow you to paint higher timeframe(tf) bars on lower tf chart. You could for example have a weekly and/or daily bar on 1h tf like this:

You can also select to show only periods, or highs/lows:

CBar(aka HLBar v3):
Cbar, previously known as HLBar paint customized bars/candles with many options to chose. CBar stand for "custom bar". You can make it paint OHLC(like standard candle but wicks have a same width as body), HL only(very useful for line charts, viz. LCHMA indicator below), HL peaks only(useful for line charts as well) and in this latest version you can also chose width to the point it will leave no space in between. First pic above already show CBar with default width as well, following 2 pics show width 1 and 2:

And for line chart to show only HL peaks:
 LCHMA:
LCHMA stands for "line chart moving average". It is exactly same as line chart, but since its an indicator it can be painted on top of other things. This is SMA with hardcoded period of 1. At the time of creating it, original Dukascopy`s SMA only support lowest period of 2, which is not same anymore. You can still achieve same with Linear Regression MA set to lowest 2, but to avoid unnecessary over-calculations I created this.
Now I show you how you can use LCHMA with combination of previous CBar indicator:

Alas, now you have a line chart and see highs and lows at the same time.
LCI:
LCI stands for "last close indicator" and paint a tiny dot on the last close period:

This way you know exactly where last period ended and where current volatility is, this is extremely helpful for line charts because they can repaint badly on current price movement before they close - changing whole picture.
Thats it. You can make some real beauty from these tools, following 2 pics are for your inspiration:

All of these 4 indicators including their source code can be downloaded in the forum:
https://www.dukascopy.com/swiss/english/forex/jforex/forum/viewtopic.php?f=77&t=54029
Hope these tools help you, bye ^_`.
- Dukascopy take no responsibility for any modified indicators released by me
- I provide my indicators with no warranty, use at your own risk
- I am releasing them under same unmodified license as original indicators
- You are allowed to use them for your own personal use, disallowed for any commercial use or to sell them
Now after boring part is done, lets start:
HLBox(updated to v1.2):
This indicator allow you to paint higher timeframe(tf) bars on lower tf chart. You could for example have a weekly and/or daily bar on 1h tf like this:

You can also select to show only periods, or highs/lows:

CBar(aka HLBar v3):
Cbar, previously known as HLBar paint customized bars/candles with many options to chose. CBar stand for "custom bar". You can make it paint OHLC(like standard candle but wicks have a same width as body), HL only(very useful for line charts, viz. LCHMA indicator below), HL peaks only(useful for line charts as well) and in this latest version you can also chose width to the point it will leave no space in between. First pic above already show CBar with default width as well, following 2 pics show width 1 and 2:

And for line chart to show only HL peaks:
 LCHMA:
LCHMA stands for "line chart moving average". It is exactly same as line chart, but since its an indicator it can be painted on top of other things. This is SMA with hardcoded period of 1. At the time of creating it, original Dukascopy`s SMA only support lowest period of 2, which is not same anymore. You can still achieve same with Linear Regression MA set to lowest 2, but to avoid unnecessary over-calculations I created this.
Now I show you how you can use LCHMA with combination of previous CBar indicator:

Alas, now you have a line chart and see highs and lows at the same time.
LCI:
LCI stands for "last close indicator" and paint a tiny dot on the last close period:

This way you know exactly where last period ended and where current volatility is, this is extremely helpful for line charts because they can repaint badly on current price movement before they close - changing whole picture.
Thats it. You can make some real beauty from these tools, following 2 pics are for your inspiration:

All of these 4 indicators including their source code can be downloaded in the forum:
https://www.dukascopy.com/swiss/english/forex/jforex/forum/viewtopic.php?f=77&t=54029
Hope these tools help you, bye ^_`.

