A Simple Way to Scalp Forex Market
Practice VolatilityI want to showyou how my system work . Squeeze The most important of my system are squeeze and volatility . RSI and EMA 5 help me to find the direction of the price. The Squeeze consists two steps: There is a period of low volatility. The means that the bands arenarrow and price is moving relatively sideways.
The low volatility period is followed by a surge in volatility andprice breaks through the Upper Band or falls through the Lower Band signifying
a change in the sideways movement and the beginning of a new directional trend.
In a Bullish BB (Bollinger Bands ) Squeeze Price breaks through the Upper Band which starts a new upwardtrend. Volatility also increases. In a Bearish BB Squeeze Price falls below the Lower Band which starts a new downwardtrend. Volatility also increases.
We can see direction of trend with the help of RSI ,EMA 5 .
Let’s watch these charts :
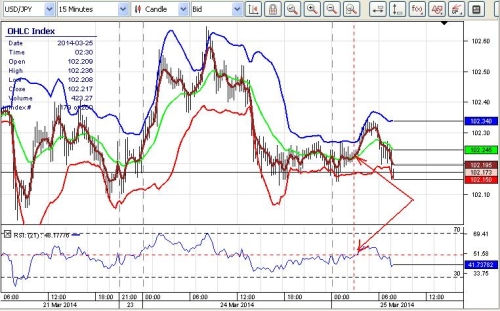
EMA 5 isabove middle band of Bollinger Band ,but RSI is under 50 level of RSI, false
signal ,it is shown by red arrows .
Let’s see where we can do some money .
GBP/JPY
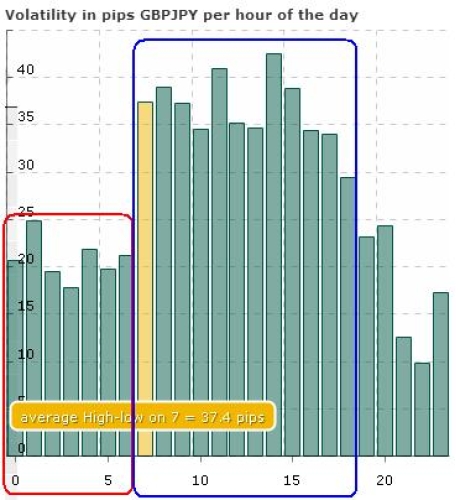
Red rectangle ,low volatility ,Blue rectangle, high volatility .We need a litle help for direction of the price .
Spot Chart :
GBP/AUD
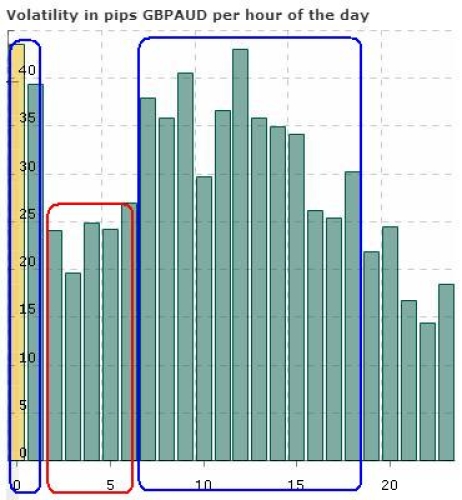
Red rectangle ,low volatility ,Blue rectangle, high volatility .We need a litle help for direction of the price .
Spot Chart :
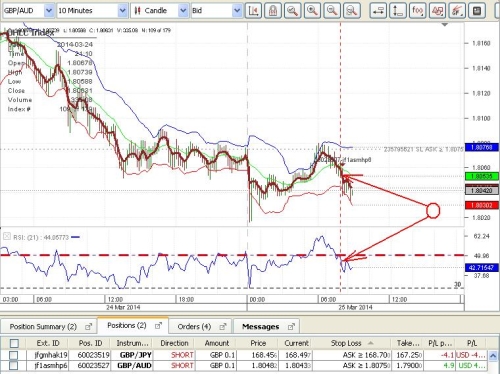
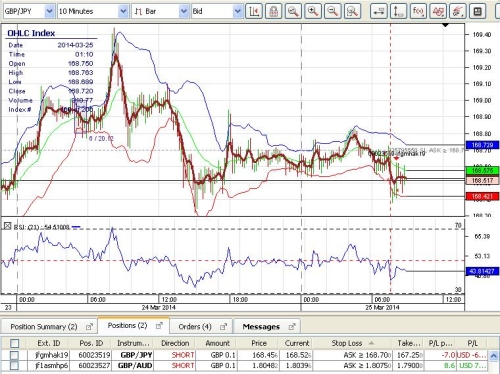
Red arrows show us where EMA 5 cross middle band ( from Bollinger Band ) and also cross down 50 level of RSI .
Now I wait ….

