Up or down, this is the question now!
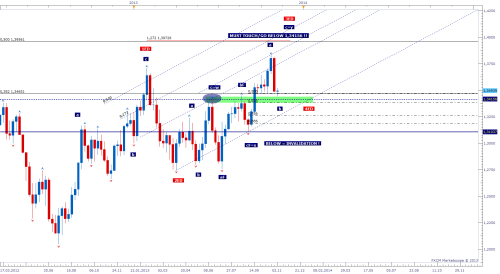
Let´s start with my favorite weekly chart. As seen I expect low of wave b in third wave of Ending diagonal. Price is at solid support, 50% of wave a and 38,2% from 2008 HH @1,60369 to 2010 LL @ 1,18754, wave which I consider as first in last of very long time lasting correction. Target of this move down is at least to touch 1,34156 peak labeled c=w, and just below @1,33817 is 61,8 retracement of wave last wave up, labeled a.

Daily charttells nothing special just shows developing congestion.
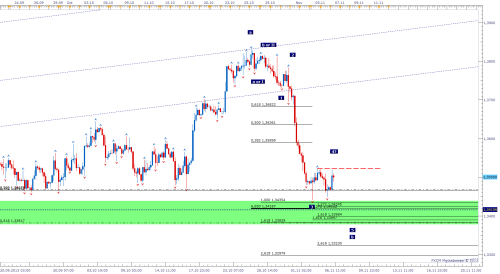
H4 charttells me more; I find move down as most probable Zig Zag pattern with extended 5 waves c leg in progress and currently in 4th wave; question is iftop is in place or not.
If not andprice comes above last high @1,35233 my count could come under question (if price does not come below last LL today) and move up can unfold and there in the middle it could form right shoulder. Whipsaw would not surprise me.
If movedown will develop, it would be 5th wave with targets 1,3435, 1,3383and 1,3298. On the way down move would hit my mentioned target (1,34156 peak) and would form Butterfly Buy with most distance target around 1,3395.

Good trading!
Let´s start with my favorite weekly chart. As seen I expect low of wave b in third wave of Ending diagonal. Price is at solid support, 50% of wave a and 38,2% from 2008 HH @1,60369 to 2010 LL @ 1,18754, wave which I consider as first in last of very long time lasting correction. Target of this move down is at least to touch 1,34156 peak labeled c=w, and just below @1,33817 is 61,8 retracement of wave last wave up, labeled a.

Daily charttells nothing special just shows developing congestion.
H4 charttells me more; I find move down as most probable Zig Zag pattern with extended 5 waves c leg in progress and currently in 4th wave; question is iftop is in place or not.
If not andprice comes above last high @1,35233 my count could come under question (if price does not come below last LL today) and move up can unfold and there in the middle it could form right shoulder. Whipsaw would not surprise me.
If movedown will develop, it would be 5th wave with targets 1,3435, 1,3383and 1,3298. On the way down move would hit my mentioned target (1,34156 peak) and would form Butterfly Buy with most distance target around 1,3395.

Good trading!

